
Overview
The fourth problem set asked to find the largest palindrome as a product of two numbers of size N (specified in the problem). A palindrome is a number with bilateral reflective symmetry (if the digit count is even). 123321, 90000600009, and 33 are all examples. As you can see with the middle example, the middle number can be any other number, so long as the other even digit-count numbers on either side follow the same bilateral reflective symmetry.
Things I Tried
My first idea was to create a list of numbers in the range of possible factors, squaring each number to check for symmetry. I ran into two problems with this strategy. First, it only looked for squares, which ignored possible solutions. Second, it started with answers which were too small for the desired result range.
I next tried to create a nested for loop to correctly account for non-squares, but decided against finishing that path before I had fully fleshed out the problems.
Solution Explained
The solution I settled on was one posted by Anant Agarwal on GeeksforGeeks.
It starts by creating a user-defined function for the factor size you want (only effective up to N = 4, because anything larger is not smoothly calculated). It then implements a mathematical formula for flipping a number to check if the numbers match. One of the operators used in the original script is a floor division symbol, which doesn’t exist in R. Aside from that, the code is fairly self-explanatory.
Graphing Timing and Results (First Four)
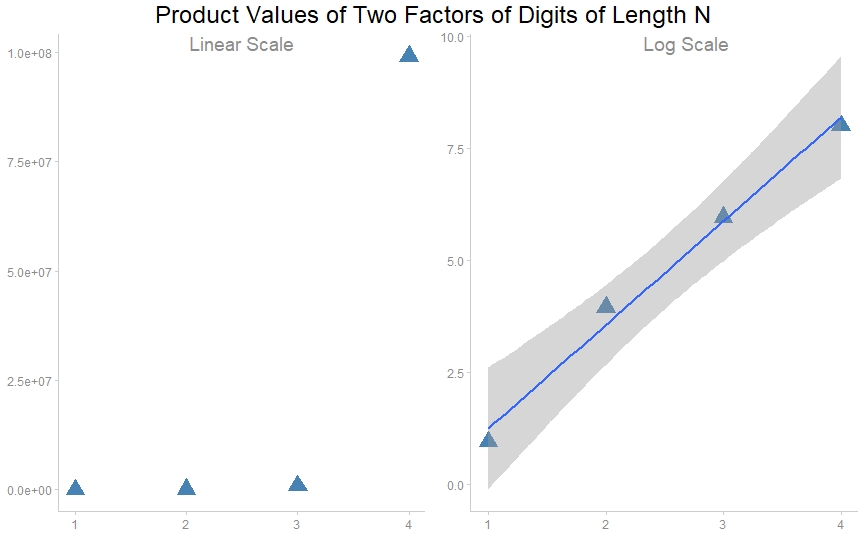
The way the numbers steeply climb appeared exponential, so I created a few plots to illustrate the point. I’m still working on the groundhog package, so I defaulted to normal package running methods first. The first four palindromic numbers as multiples of other numbers of digit lengths 1 through 4 are 9, 9009, 906609, and 99000099.
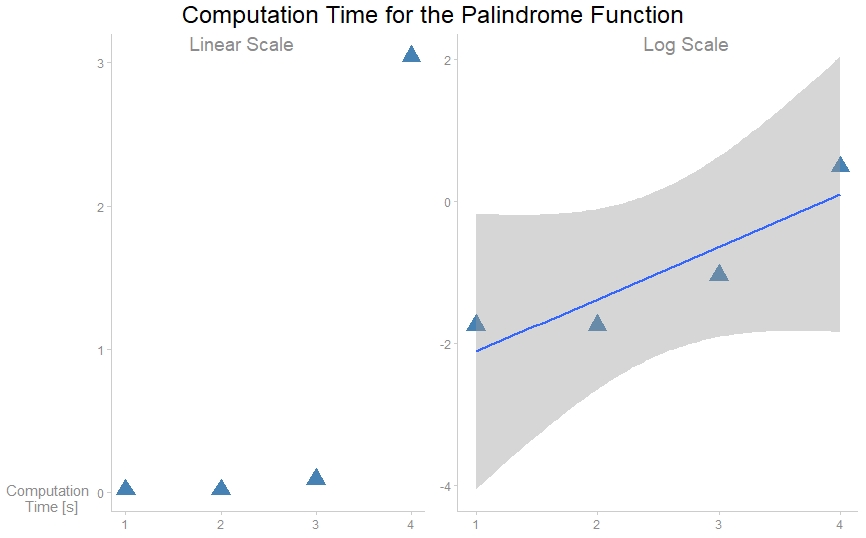
I also plotted the time it took this program to find each one of these four palindromes. There are more efficient methods to find the palindromes, but with these, the time it took to calculate the palindromes followed a similar pattern, although the linearity wasn’t quite as pronounced.
Thoughts for Future Problems
I got stuck after a while on this one and found an existing solution to translate into R. While that worked, I felt that I jumped the gun a bit with this one. I’ll be starting future problems on the weekend and will only look for existing solutions to translate after 5 days of attempts on my own. I got closer this time than on the third problem set, but it still would have been better to wait a bit longer before trying someone else’s code. That said, the opportunity to discover the ggpubr package and play with ggplot2 a bit more was valuable.